티스토리 뷰
Numpy 기초
1. NumPy 배열
- NumPy는 과학 연산을 위한 파이썬 핵심 라이브러리
- NumPy는 고성능 다차원 배열과 이런 배열을 처리하는 다양한 함수와 툴을 제공
사용법
import numpy as np버전확인
np.__version__NumPy 배열구조는 Shape이다
- 배열은 파이썬 튜플 자료형을 이용하여 정의한다.
- shape가 (28, 28, 3)이라면 3차원 배열이고 사진은 높이가 28, 폭이 28, 각 픽셀은 4개 채널(RGB)로 구성된 데이터 구조를 갖는다.
- 다차원 배열은 입체적인 데이터 구조를 가지고 데이터의 차원은 여러 갈래의 데이터 방향을 갖는다. 이때 데이터 방향은 axis로 표현할 수 있다.
- 향방향(높이), 열방향(폭), 채널 방향은 각각 axis=0, axis=1 그리고 axis=2로 지정된다. NumPy 집계(aggregation) 함수는 배열 데이터의 집계 방향을 지정하는 axis 옵션을 제공합니다.
NumPy 배열 생성
1차원 NumPy 배열 생성
arr = [1, 2, 3]
a = np.array([1, 2, 3])
arr.shape - 3
arr.ndim - 1
arr.dtype - int64
[1 2 3]2차원 NumPy 배열 생성
arr = [(1,2,3), (4,5,6)]
a= np.array(arr, dtype = float)
arr.shape - 2, 3
arr.ndim - 2
arr.dtype - float64
[[ 1.  2.  3.]
[ 4.  5.  6.]]
3차원 NumPy 배열 생성
arr = np.array([[[1,2,3], [4,5,6]], [[3,2,1], [4,5,6]]], dtype = float)
a= np.array(arr, dtype = float)
arr.shape - 2,, 2, 3
arr.ndim - 3
arr.dtype - float64
[[[ 1.  2.  3.]
[ 4.  5.  6.]]

[[ 3.  2.  1.]
[ 4.  5.  6.]]]
데이터 타입을 입력하여 NumPy 배열을 생성한다. dtype을 생략할 경우, 입력된 lsit 객체의 요소 타입이 설정된다.
np.zeros
- zeros(shape, dtype=float, order='C')
- 지정된 shape의 배열을 생성하고, 모든 요소를 0으로 초기화
a = np.zeros((3, 4))[[ 0. 0. 0. 0.]
[ 0. 0. 0. 0.]
[ 0. 0. 0. 0.]]np.ones
- np.ones(shape, dtype=None, order='C')
- 지정된 shape의 배열을 생성하고, 모든 요소를 1로 초기화
a = np.ones((2,3,4),dtype=np.int16)[[[1 1 1 1]
[1 1 1 1]
[1 1 1 1]]
[[1 1 1 1]
[1 1 1 1]
[1 1 1 1]]]np.full
- np.full(shape, fill_value, dtype=None, order='C')
- 지정된 shape의 배열을 생성하고, 모든 요소를 지정한 "fill_value"로 초기화
a = np.full((2,2),7)[[7 7]
[7 7]]np.eye
- np.eye(N, M=None, k=0, dtype=<class 'float'>)
- (N, N) shape의 단위 행렬(Unit Matrix)을 생성
np.eye(4)array([[ 1., 0., 0., 0.],
[ 0., 1., 0., 0.],
[ 0., 0., 1., 0.],
[ 0., 0., 0., 1.]])np.empty
- empty(shape, dtype=float, order='C')
- 지정된 shape의 배열 생성
- 요소의 초기화 과정에 없고, 기존 메모리값을 그대로 사용
- 배열 생성비용이 가장 저렴하고 빠름
- 배열 사용 시 주의가 필요(초기화를 고려)
a = np.empty((4,2))[[ 0.00000000e+000 6.91240343e-310]
[ 6.91240500e-310 5.39088070e-317]
[ 5.39084907e-317 6.91239798e-310]
[ 3.16202013e-322 6.91239798e-310]]데이터 생성 합수
np.linspace
- numpy.linspace(start, stop, num=50, endpoint=True, retstep=False, dtype=None)
- start부터 stop의 범위에서 num개를 균일한 간격으로 데이터를 생성하고 배열을 만드는 함수
- 요소 개수를 기준으로 균등 간격의 배열을 생성
a = np.linspace(0, 1, 5)[ 0. 0.25 0.5 0.75 1. ]import matplotlib.pyplot as plt
plt.plot(a, 'o')
plt.show()
np.arange
- numpy.arange([start,] stop[, step,], dtype=None)
- start부터 stop 미만까지 step 간격으로 데이터 생성한 후 배열을 만듦
- 범위내에서 간격을 기준 균등 간격의 배열
- 요소의 객수가 아닌 데이터의 간격을 기준으로 배열 생성
a = np.arange(0, 10, 2, np.float)[ 0. 2. 4. 6. 8.]np.logspace
- numpy.logspace(start, stop, num=50, endpoint=True, base=10.0, dtype=None)
- 로그 스케일의 linspace 함수
- 로그 스케일로 지정된 범위에서 num 개수만큼 균등 간격으로 데이터 생성한 후 배열 만듦
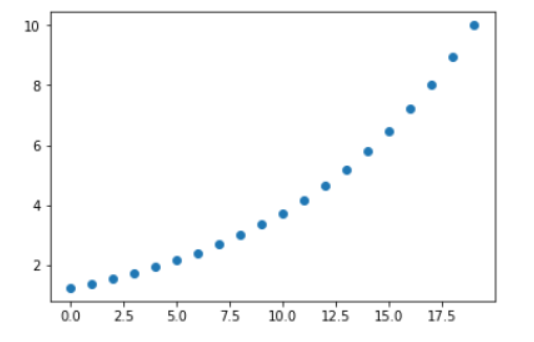
a = np.logspace(0.1, 1, 20, endpoint=True)[ 1.25892541 1.40400425 1.565802 1.74624535 1.94748304
2.1719114 2.42220294 2.70133812 3.0126409 3.35981829
3.74700446 4.17881006 4.66037703 5.19743987 5.79639395
6.46437163 7.2093272 8.04013161 8.9666781 10. ]# logspace의 데이터 추출 시각화
import matplotlib.pyplot as plt
plt.plot(a, 'o')
plt.show()
np.logspace
- numpy.logspace(start, stop, num=50, endpoint=True, base=10.0, dtype=None)
- 로그 스케일의 linspace 함수
- 로그 스케일로 지정된 범위에서 num 개수만큼 균등 간격으로 데이터 생성한 후 배열 만듦
a = np.logspace(0.1, 1, 20, endpoint=True)[ 1.25892541 1.40400425 1.565802 1.74624535 1.94748304 2.1719114 2.42220294 2.70133812 3.0126409 3.35981829 3.74700446 4.17881006 4.66037703 5.19743987 5.79639395 6.46437163 7.2093272 8.04013161 8.9666781 10. ]# logspace의 데이터 추출 시각화 import matplotlib.pyplot as plt plt.plot(a, 'o') plt.show()

np.random.normal
- normal(loc=0.0, scale=1.0, size=None)
- 정규 분포 확률 밀도에서 표본 추출
- loc: 정규 분포의 평균
- scale: 표준편차
mean = 0
std = 1
a = np.random.normal(mean, std, (2, 3))
[[ 1.4192442 -2.0771293 1.84898108]
[-0.12303317 1.04533993 1.94901387]]data = np.random.normal(0, 1, 10000)
import matplotlib.pyplot as plt
plt.hist(data, bins=100)
plt.show()
- np.random.normal이 생성한 난수는 정규 분포의 형상을 갖습니다.
- 다음 예제는 정규 분포로 10000개 표본을 뽑은 결과를 히스토그램으로 표현한 예입니다.
- 표본 10000개의 배열을 100개 구간으로 구분할 때, 정규 분포 형태를 보이고 있습니다.
np,random.rand
- numpy.random.rand(d0, d1, ..., dn)
- Shape이 (d0, d1, ..., dn) 인 배열 생성 후 난수로 초기화
- 난수: [0. 1)의 균등 분포(Uniform Distribution) 형상으로 표본 추출
- Gaussina normal
a = np.random.rand(3,2)[[ 0.1258167 0.25474262]
[ 0.25514046 0.0918946 ]
[ 0.19843316 0.73586066]]
data = np.random.rand(10000)
import matplotlib.pyplot as plt
plt.hist(data, bins=10)
plt.show()
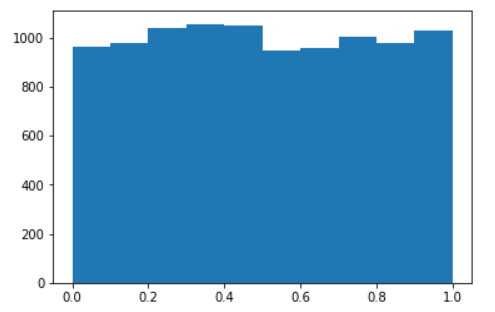
- np.random.rand는 균등한 비율로 표본 추출
- 다음 예제는 균등 분포로 10000개를 표본 추출한 결과를 히스토그램으로 표현한 예입니다.
- 표본 10000개의 배열을 10개 구간으로 구분했을때 균등한 분포 형태를 보이고 있습니다.
np.random.randn
- numpy.random.randn(d0, d1, ..., dn)
- (d0, d1, ..., dn) shape 배열 생성 후 난수로 초기화
- 난수: 표준 정규 분포(standard normal distribution)에서 표본 추출
a = np.random.randn(2, 4)

[[ 0.81791892  0.74967685 -0.20023471  0.76089888]
[-1.13037451 -0.52569743 -1.33934774  0.75105868]]
[[ 0.81791892 0.74967685 -0.20023471 0.76089888]
[-1.13037451 -0.52569743 -1.33934774 0.75105868]]
data = np.random.randn(10000)
import matplotlib.pyplot as plt
plt.hist(data, bins=10)
plt.show()

np.random.randint
- numpy.random.randint(low, high=None, size=None, dtype='l')
- 지정된 shape으로 배열을 만들고 low 부터 high 미만의 범위에서 정수 표본 추출
a = np.random.randint(5, 10, size=(2, 4))[[5 5 6 6]
[7 9 7 9]]
a = np.random.randint(1, size=10)[0 0 0 0 0 0 0 0 0 0]
data = np.random.randint(-100, 100, 10000)
import matplotlib.pyplot as plt
plt.hist(data, bins=10)
plt.show()

- 100에서 100의 범위에서 정수를 균등하게 표본 추출합니다.
- 다음 예제에서 균등 분포로 10000개를 표본 추출한 결과를 히스토그램으로 표현한 예입니다.
- 표본 10000개의 배열을 10개 구간으로 구분했을때 균등한 분포 형태를 보이고 있습니다.
np.ramdom.random
- np.random.random(size=None)
- 난수: [0., 1.)의 균등 분포(Uniform Distribution)에서 표본 추출
a = np.random.random((2, 4))
[[ 0.92646678 0.02811114 0.97379431 0.86712785]
[ 0.18829149 0.78809537 0.52076073 0.71967828]]
data = np.random.random(100000)
import matplotlib.pyplot as plt
plt.hist(data, bins=10)
plt.show()
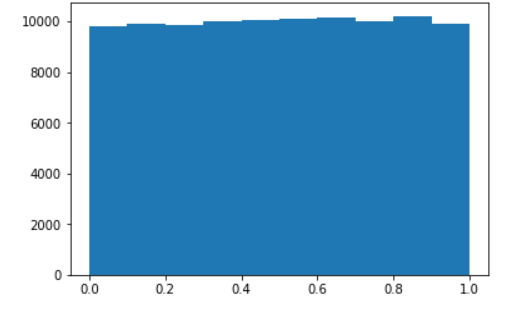
- np.random.random은 균등 분포로 표본을 추출합니다.
- 다음 예제는 정규 분포로 10000개를 표본 추출한 결과를 히스토그램으로 표현한 예입니다.
- 표본 10000개의 배열을 10개 구간으로 구분했을때 정규 분포 형태를 보이고 있습니다.
random 모듈의 함수
같은거 실행해도 랜덤으로 계속 바뀐다.
np.random.random((2, 2))array([[ 0.37177011, 0.80381439],
[ 0.98299691, 0.91079526]])
np.random.randint(0, 10, (2, 3))
array([[0, 1, 7],
     [0, 2, 3]])
array([[0, 1, 7],
[0, 2, 3]])
np.random.seed 함수
seed값을 설정하면 같은 seed인 경우에 같은 난수가 나온다.
# seed 값을 설정하여 아래에서 난수가 재연 가능하도록 함
np.random.seed(100)
np.random.random((2, 2))
array([[ 0.54340494, 0.27836939],
[ 0.42451759, 0.84477613]])
NumPy 입출력
NumPy는 배열 객체를 바이너리 파일 혹은 텍스트 파일에 저장하고 로딩하는 기능을 제공합니다.
| np.save() | NumPy 배열 객체 1개를 파일에 저장 | 바이너리 |
| np.savez() | NumPy 배열 객체 복수개를 파일에 저장 | 바이너리 |
| np.load() | NumPy 배열 저장 파일로 부터 객체 로딩 | 바이너리 |
| np.loadtxt() | 텍스트 파일로 부터 배열 로딩 | 텍스트 |
| np.savetxt() | 텍스트 파일에 NumPy 배열 객체 저장 | 텍스트 |
# 아래의 a, b를 사용한다.
a = np.random.randint(0, 10, (2, 3))
b = np.random.randint(0, 10, (2, 3))
a
[[8 7 4]
[4 3 8]]
b
[[6 9 8]
[9 7 7]]
배열객체 저장하기
np.save 함수와 np.savez 함수를 이용하여 배열 객체를 파일로 저장할 수 있습니다.
- np.save: 1개 배열 저장, 확장자: npy
- np.savez: 복수 배열을 1개의 파일에 저장, 확장자: pnz
- 배열 저장 파일은 바이너리 형태입니다.
# a배열 파일에 저장(1개 배열 파일에 저장)
np.save("./array1", a)
# 파일 조회
!ls -al array1*
# a, b 두 개 배열을 파일에 저장(복수 배열을 파일에 저장)
np.savez("my_array2", a, b)
# 파일 조회
!ls -al my_array2*
파일에서 배열 로딩
npy와 npz 파일은 np.load 함수로 읽을 수 있다.
# 1개 배열 로딩
np.load("./array1.npy")
>array([[8, 7, 4],
      [4, 3, 8]])

# 복수 파일 로딩
npzfiles = np.load("./array2.npz")
npzfiles.files
> ['arr_0', 'arr_1']

npzfiles['arr_0']
>array([[8, 7, 4],
      [4, 3, 8]])

npzfiles['arr_1']
>array([[6, 9, 8],
      [9, 7, 7]])
텍스트 파일 로딩
텍스트 파일을 np.loadtxt 로 로딩 할 수 있다.
- np.loadtxt(fname, dtype=<class 'float'>, comments='#', delimiter=None, converters=None, skiprows=0, usecols=None, unpack=False, ndmin=0)
- fname: 파일명
- dtype: 데이터 타입
- comments: comment 시작 부호
- delimiter: 구분자
- skiprows: 제외 라인 수(header 제거용)
# 기본 파일위치와 파일 내용 알아보기
!ls -al ./data/simple.csv
> -rw-r--r-- 1 root root 15  9월 03 17:23 ./data/simple.csv

!cat ./data/simple.csv
> 1 2 3
 4 5 6
#기본 데이터 타입은 float을 설정됩니다.
#파일 데이터 배열로 로딩
np.loadtxt("./data/simple.csv")
> array([[ 1., 2., 3.],
[ 4., 5., 6.]])
#dype 속성으로 데이터 타입 변경 가능합니다.
#파일 데이터 배열로 로딩 및 데이터 타입 지정
np.loadtxt("./data/simple.csv", dtype=np.int)
> array([[1, 2, 3],
[4, 5, 6]])
문자열 포함된 파일 로딩
- president_height.csv 파일은 숫자와 문자를 모두 포함하는 데이터 파일입니다.
- dtype을 이용하여 컬럼 타입을 지정하여 로딩합니다.
- delimiter와 skiprows를 이용하여 구분자와 무시해야 할 라인을 지정합니다.
-president_height.csv 내용-
order,name,height(cm)
1,George Washington,189
2,John Adams,170
# dtype에 dict 형식으로 데이터 ㅌ입 지정
data = np.loadtxt("./data/president_height.csv", delimiter=",", skiprows=1, dtype={
  'names': ("order","name","height"),
  'formats':('i', 'S20', 'f')
})
# 배열 데이터 출력
data[:3]

> array([(1, b'George Washington',  189.), (2, b'John Adams',  170.),
     (3, b'Thomas Jefferson',  189.)],
    dtype=[('order', '<i4'), ('name', 'S20'), ('height', '<f4')])
배열을 텍스트 파일로 저장
- np.savetxt 함수를 이용하여 배열 객체를 텍스트 파일로 저장할 수 있습니다.
- np.savetxt(fname, X, fmt='%.18e', delimiter=' ', newline='\n', header='', footer='', comments='# ')
# 데모 데이터 생성
data = np.random.random((3, 4))
[[ 0.21554899  0.56103576  0.71822224  0.42060378]
[ 0.59906291  0.51097642  0.37703684  0.48276954]
[ 0.1889987   0.62604535  0.88074236  0.01603881]]

# 배열 객체 텍스트 파일로 저장
np.savetxt("./data/saved.csv", data, delimiter=",")

#파일 조회
!ls -al ./data/saved.csv

#파일 내용 저회
!cat ./data/saved.csv
2.155489877688239186e-01,5.610357577617570701e-01,7.182222391102696113e-01,4.206037807135534212e-01
5.990629079875264829e-01,5.109764156401283008e-01,3.770368358788609431e-01,4.827695415663437739e-01
1.889986982230907886e-01,6.260453490415701649e-01,8.807423613788849526e-01,1.603880803818769074e-02

# 데이터 파일 로딩
np.loadtxt('./data/saved.csv', delimiter=',')
array([[ 0.21554899,  0.56103576,  0.71822224,  0.42060378],
     [ 0.59906291,  0.51097642,  0.37703684,  0.48276954],
     [ 0.1889987 ,  0.62604535,  0.88074236,  0.01603881]])
데이터 타입
NumPy는 다음과 같은 데이터 타입을 지원한다. 배열을 생성할 때 dtype속성으로 다음과 같은 데이터 타입을 지정할 수 있다.
- np.int64 : 64 비트 정수 타입
- np.float32 : 32 비트 부동 소수 타입
- np.complex : 복소수 (128 float)
- np.bool : 불린 타입 (Trur, False)
- np.object : 파이썬 객체 타입
- np.string_ : 고정자리 스트링 타입
- np.unicode_ : 고정자리 유니코드 타입
배열 속성 확인
NumPy는 배열의 상태를 검사하는 다음과 같은 방법을 제공한다.
| 배열 shape | np.ndarray.shape 속성 | arr.shape | (5, 2, 3) |
| 배열 길이 | 일차원의 배열 길이 확인 | len(arr) | 5 |
| 배열 차원 | np.ndarray.ndim 속성 | arr.ndim | 3 |
| 배열 요소 수 | np.ndarray.size 속성 | arr.size | 30 |
| 배열 타입 | np.ndarray.dtype 속성 | arr.dtype | dtype(‘float64’) |
| 배열 타입 명 | np.ndarray.dtype.name 속성 | arr.dtype.name | float64 |
| 배열 타입 변환 | np.ndarray.astype 함수 | arr.astype(np.int) | 배열 타입 변환 |
NumPy 배열 객체는 다음과 같은 방식으로 속성을 확인할 수 있다.
#데모 배열 객체 생성
arr = np.random.random((5,2,3))

#배열 타입 조회
type(arr)
> numpy.ndarray

# 배열의 shape 확인
arr.shape
>(5, 2, 3)

# 배열의 길이
len(arr)
> 5

# 배열의 차원 수
arr.ndim
> 3

# 배열의 요소 수: shape(k, m, n) ==> k*m*n
arr.size
> 30

# 배열 타입 확인
arr.dtype
>dtype('float64')

# 배열 타입명
arr.dtype.name
> 'float64'

# 배열 요소를 int로 변환
# 요소의 실제 값이 변환되는 것이 아님
# View의 출력 타입과 연산을 변환하는 것
arr.astype(np.int)
array([[[0, 0, 0],
      [0, 0, 0]],

     [[0, 0, 0],
      [0, 0, 0]],

     [[0, 0, 0],
      [0, 0, 0]],

     [[0, 0, 0],
      [0, 0, 0]],

     [[0, 0, 0],
      [0, 0, 0]]])

# np.float으로 타입을 다시 변환하면 np.int 변환 이전 값으로 모든 원소 값이 복원됨
arr.astype(np.float)
array([[[ 0.16384724,  0.14102935,  0.13880948],
      [ 0.75155573,  0.41813362,  0.32200517]],

     [[ 0.15771594,  0.15517552,  0.73518959],
      [ 0.45756098,  0.47543577,  0.5771006 ]],

     [[ 0.21845306,  0.10044739,  0.63770484],
      [ 0.36300707,  0.67294698,  0.9287396 ]],

     [[ 0.17435257,  0.90261209,  0.16389656],
      [ 0.8118577 ,  0.36231545,  0.26170523]],

     [[ 0.41849605,  0.44730829,  0.03815196],
      [ 0.03938546,  0.45850899,  0.15059227]]])
np.info 함수
np.info(np.ndarray.dtype)
Data-type of the array's elements.

Parameters
----------
None

Returns
-------
d : numpy dtype object

See Also
--------
numpy.dtype

Examples
--------
>>> x
array([[0, 1],
     [2, 3]])
>>> x.dtype
dtype('int32')
>>> type(x.dtype)
<type 'numpy.dtype'>

np.info(np.squeeze)
 squeeze(a, axis=None)

Remove single-dimensional entries from the shape of an array.

Parameters
----------
a : array_like
  Input data.
axis : None or int or tuple of ints, optional
  .. versionadded:: 1.7.0

  Selects a subset of the single-dimensional entries in the
  shape. If an axis is selected with shape entry greater than
  one, an error is raised.

Returns
-------
squeezed : ndarray
  The input array, but with all or a subset of the
  dimensions of length 1 removed. This is always `a` itself
  or a view into `a`.

Raises
------
ValueError
  If `axis` is not `None`, and an axis being squeezed is not of length 1

See Also
--------
expand_dims : The inverse operation, adding singleton dimensions
reshape : Insert, remove, and combine dimensions, and resize existing ones

Examples
--------
>>> x = np.array([[[0], [1], [2]]])
>>> x.shape
(1, 3, 1)
>>> np.squeeze(x).shape
(3,)
>>> np.squeeze(x, axis=0).shape
(3, 1)
>>> np.squeeze(x, axis=1).shape
Traceback (most recent call last):
...
ValueError: cannot select an axis to squeeze out which has size not equal to one
>>> np.squeeze(x, axis=2).shape
(1, 3)
'인공지능(Artificial Intelligence) > python' 카테고리의 다른 글
| python 올림, 내림, 반올림 기초정리 (0) | 2020.12.22 |
|---|---|
| argparse 사용법 (0) | 2020.09.21 |
| Data Structure_Collections (0) | 2020.07.11 |
| pythonic Code_Asterisk(*) (0) | 2020.07.10 |
| Pythonic Code_Lambda&Map,Reduce (0) | 2020.07.10 |
- Total
- Today
- Yesterday
- error:0308010C:digital envelope routines::unsupported
- Deque
- read_csv
- nextjs autoFocus
- Vue
- login
- react autoFocus
- react
- pandas
- next.config.js
- 자료구조
- Queue
- 자연어처리
- vuejs
- DFS
- JavaScript
- mongoDB
- NextJS
- Python
- nodejs
- UserCreationForm
- useState
- django
- typescript
- logout
- TensorFlow
- BFS
- 클라우데라
- Express
- useHistory 안됨
| 일 | 월 | 화 | 수 | 목 | 금 | 토 |
|---|---|---|---|---|---|---|
| 1 | 2 | 3 | 4 | 5 | 6 | 7 |
| 8 | 9 | 10 | 11 | 12 | 13 | 14 |
| 15 | 16 | 17 | 18 | 19 | 20 | 21 |
| 22 | 23 | 24 | 25 | 26 | 27 | 28 |
