티스토리 뷰
반응형
랜덤포레스트
import numpy as np
import pandas as pd
import plotly.graph_objects as go
import plotly.subplots as ms
import statsmodels.api as sm
from sklearn.model_selection import train_test_split
from sklearn.ensemble import RandomForestClassifier
from sklearn.metrics import accuracy_score

X_train, X_test, y_train, y_test = train_test_split(X,y, test_size = 0.3, random_state = 0)
model = RandomForestClassifier(criterion='entropy')
model.fit(X,y)
feature_importance = pd.DataFrame({
    'feature': X.columns,
    'importance': model.feature_importances_
})
feature_importance
'''
                     feature  importance
0                        age    0.089446
1                    anaemia    0.013850
2   creatinine_phosphokinase    0.083930
3                   diabetes    0.015770
4          ejection_fraction    0.117564
5        high_blood_pressure    0.013145
6                  platelets    0.080539
7           serum_creatinine    0.137782
8               serum_sodium    0.075251
9                        sex    0.013493
10                   smoking    0.012231
11                      time    0.346998
'''

# feature_importance['importance'].sort_values()
# 위의 방식은 inplace=True를 적으면 오류가 난다.
feature_importance.sort_values('importance', inplace=True)
'''
5     0.013246
9     0.013891
10    0.014319
3     0.015575
1     0.015673
8     0.071987
0     0.080466
6     0.082460
2     0.088042
4     0.119195
7     0.134757
11    0.350387
Name: importance, dtype: float64
'''

# drop=True를 안적으면 위의 index가 column으로 추가되게 된다.
feature_importance.reset_index(drop=True, inplace=True)
'''
                     feature  importance
0                        sex    0.013113
1                    smoking    0.013341
2        high_blood_pressure    0.014266
3                   diabetes    0.014928
4                    anaemia    0.016092
5               serum_sodium    0.074978
6                  platelets    0.078679
7   creatinine_phosphokinase    0.090631
8                        age    0.091246
9          ejection_fraction    0.122813
10          serum_creatinine    0.144320
11                      time    0.325593
'''
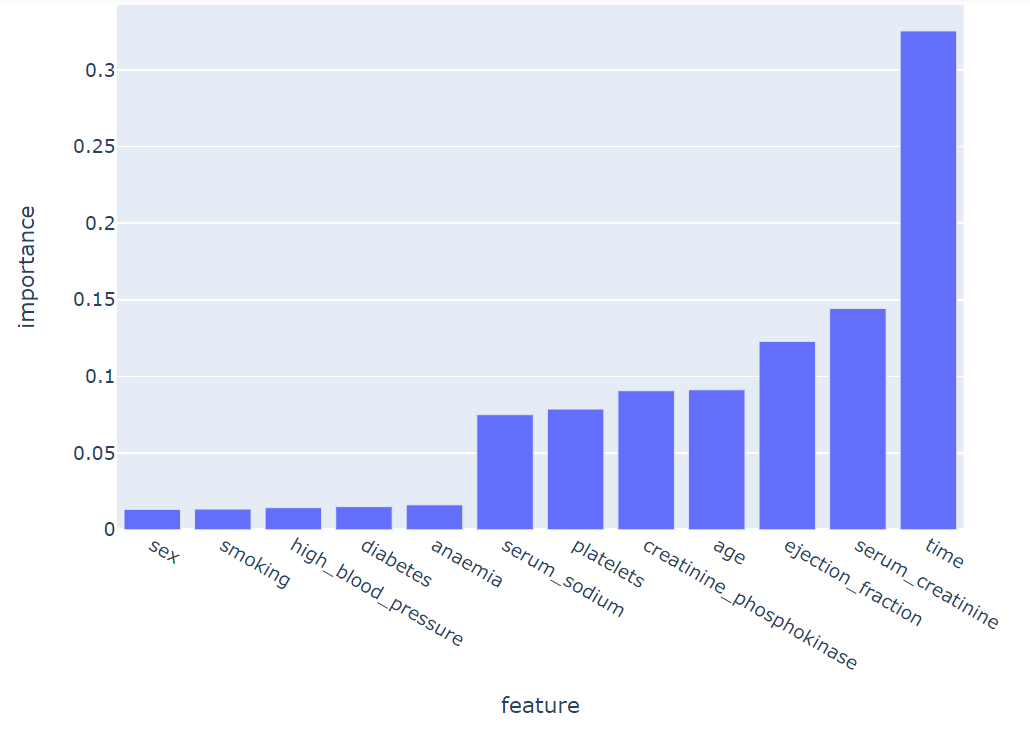
이제 위의 값에 대한 결과를 시각적으로 보는 방법은 아래와 같다.
import plotly.express as px
# 중요도별 순서 확인하기.
fig = px.bar(feature_importance, x='feature', y='importance')
fig.show()

위와 같은 결과를 확인 할 수 있다. 보면 time의 중요도가 가장 높다는 것을 알 수 있따.
반응형
'데이터분석' 카테고리의 다른 글
| [데이터분석] statsmodels을 활용한 선형 회귀분석 (3) | 2021.06.01 |
|---|---|
| [kaggle] 의료데이터_심부전증 예방하기 (0) | 2021.04.30 |
| 의료데이터 분석하기 입문 (0) | 2021.04.28 |
| [데이터 분석] 비전공자를 위한 ACF(Autocorrelation Function) 설명하기 (0) | 2021.04.07 |
| [데이터분석] 비전공자를 위한 QQ-Plot 설명하기 (0) | 2021.04.05 |
공지사항
최근에 올라온 글
최근에 달린 댓글
- Total
- Today
- Yesterday
링크
TAG
- NextJS
- django
- nextjs autoFocus
- useState
- JavaScript
- pandas
- typescript
- TensorFlow
- mongoDB
- error:0308010C:digital envelope routines::unsupported
- useHistory 안됨
- react autoFocus
- Express
- Python
- nodejs
- DFS
- next.config.js
- UserCreationForm
- BFS
- read_csv
- Queue
- 클라우데라
- login
- logout
- 자료구조
- 자연어처리
- Deque
- react
- Vue
- vuejs
| 일 | 월 | 화 | 수 | 목 | 금 | 토 |
|---|---|---|---|---|---|---|
| 1 | 2 | 3 | ||||
| 4 | 5 | 6 | 7 | 8 | 9 | 10 |
| 11 | 12 | 13 | 14 | 15 | 16 | 17 |
| 18 | 19 | 20 | 21 | 22 | 23 | 24 |
| 25 | 26 | 27 | 28 | 29 | 30 | 31 |
글 보관함
